I've spent like 10 minutes, thinking if I should post my analyses today, or leave it for tomorrow as tomorrow is the last day of the month and we'll be more closer to monthly candle close, but the truth is, I don't think it's going to change much. We can see a big wick to the upside during the Asia session, as it happens from time to time, but nothing is guaranteed.
Again, there's more than one day to the monthly candle close, but so far it looks like the current candle is going to be a bearish one. We're still on a bullish trend on this time frame as we have a higher high and don't have a lower high yet, however, for bullish continuation, price needs to close above the bearish gap (yellow on my chart), what is going to be confirmed once the current candle closes and hold that level. Next week we'll know more.
The weekly chart tells us that the bearish fair value gap (marked with yellow on the chart) is really capping the market at the moment. This week price rebalanced the gap, but failed to close above it and invert it. So this week we have a bullish engulfing candle, with a long upside wick. There are 9 more hours till the candle close, but I don't think it's going to change much.
What can we expect. Although the current candle is bullish, as i said, we still have to close above the gap ($0.2584) and hold that level. In case price shows weakness, I'd watch $0.2067 as next potential liquidity level to be swept.
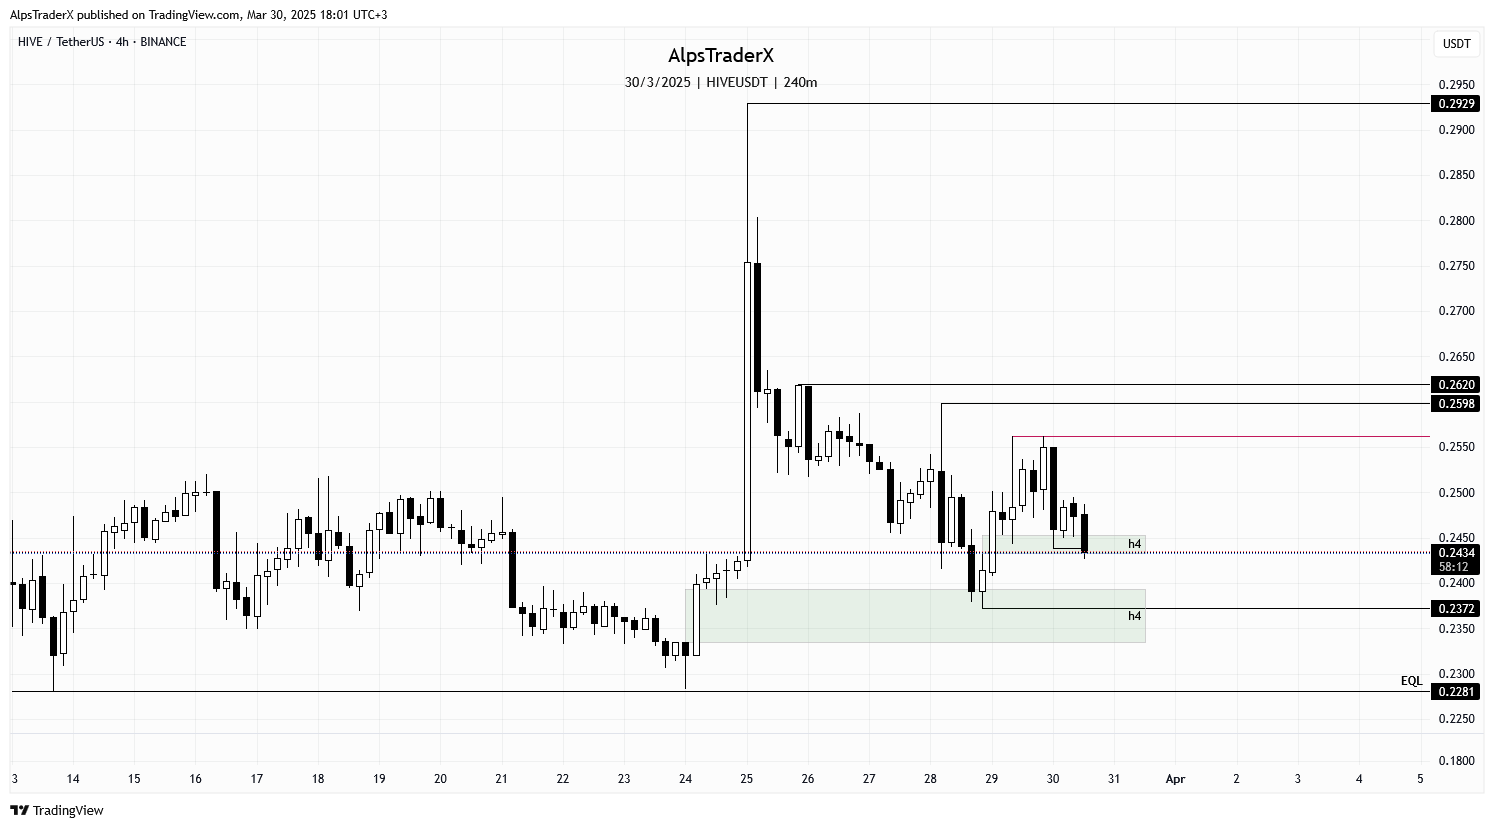
The daily chart looks interesting. At the time of writing, price is above the bullish fair value gap (green), which is holding for the moment. It was retested and rebalanced on Friday already. At this point I'm not excluding a wick down, to sweep liquidity from the $0.2372 level and we have relative equal lows at $0.2281, so there's a chance for that level to be swept as well. This can be a quick wick down to sweep liquidity under $0.2281, but still close within the gap or above, but in case the gap can't hold price, 0.$2067 is in the cards too.
The sell side, or the leg down has two big bearish gaps (yellow), so in case the bullish gap (green) manages to hold price, I'm looking at $0.2929 to be swept nest, a wick that is above a bearish gap, which has been rebalanced, but not inverted. In case price can close above the gap and hold that level ($0.2872), the next liquidity pool I'm looking at is at $0.3201, which is also inside a bearish gap. Would be nice to see price reach that level next week, but I would not hold my breath, so let's take it step by step and focus on the most obvious and closest levels first.
On a more granular scale, the h4 chart looks interesting. Price has just swept liquidity from the $0.2439 level. The current candle is closing in less than an hours, so let's see if the current bullish gap (green) can hold price, or it's going to close below the gap, which means the next potential level to be swept could be $0.2372.
In case the bullish gap manages to hold price, we have relative equal highs $0.2562, the app is marking this level for me with red. If we have continuation to the upside, after $0.2562, I'm looking at $0.2598 and $0.2620 to be swept.
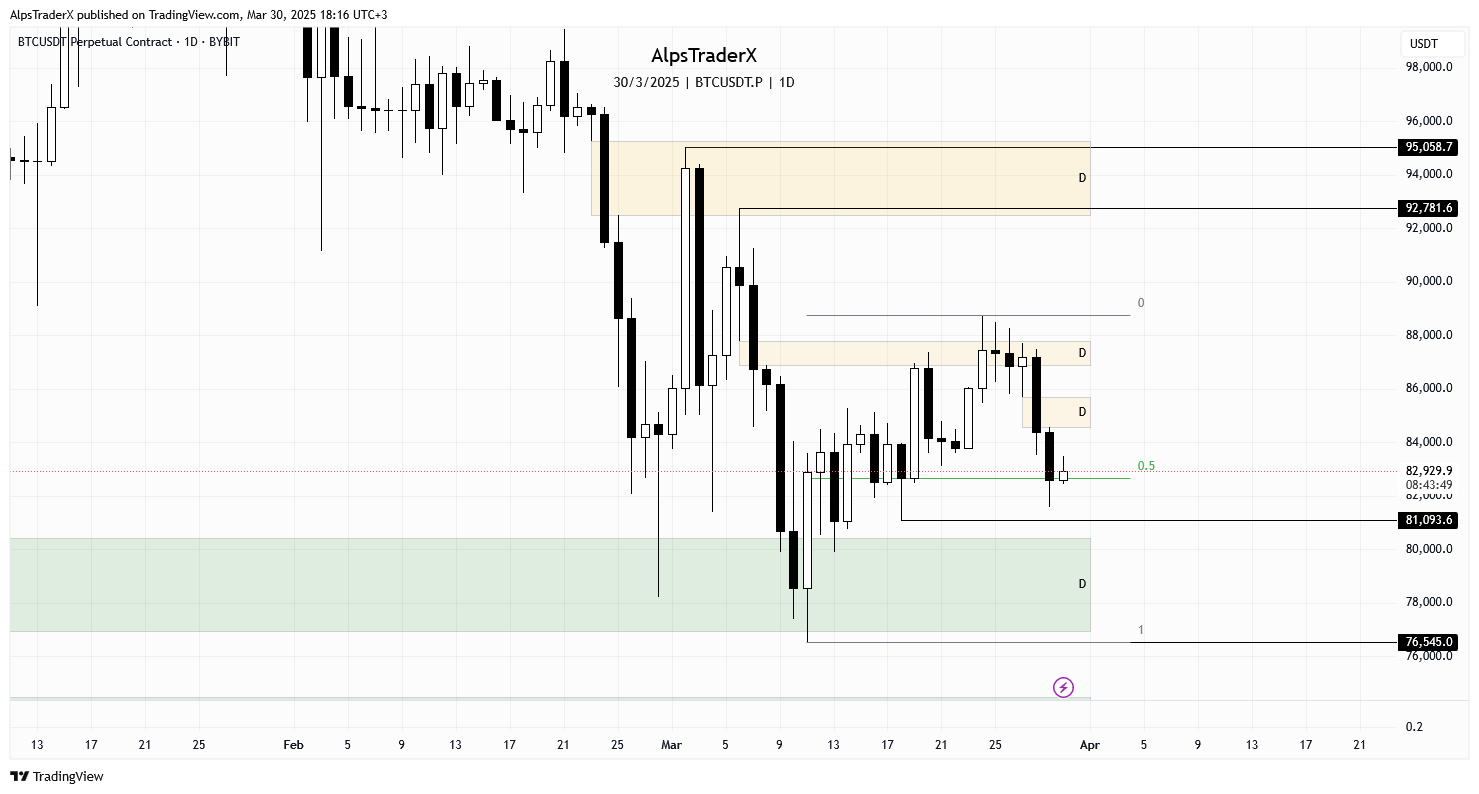
$BTC was rejected this week by the bearish gap, which is capping the market as we speak. At the time of writing, price is retesting mid-range, if I count my dealing range from the previous low, to the wick at $88,740. There's a bearish gap on the sell side, between $84,573 and $85,695, which needs to be inverted, if we want bullish continuation. The other gap above, which is capping the market at the moment, has already been rebalanced, but not inverted, do let's hope the next attempt will be successful.
In case the market shows weakness, I'm looking at $81,093 to be swept.
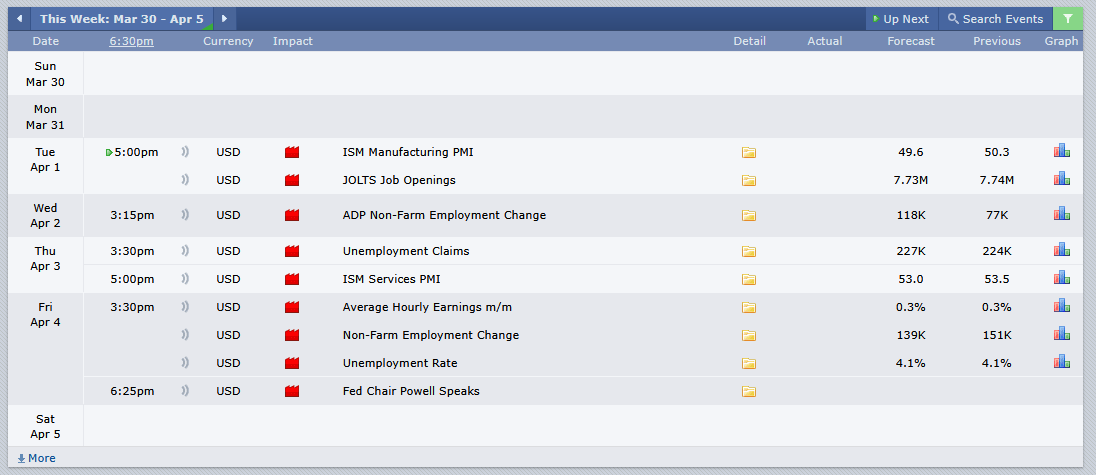
As far as the economic calendar is regarded, next week we're going to have a volatile week, I can tell you that now. We have four red folder news days announced, among which the last two will be extremely interesting. Unemployment claims and unemployment rate is very important, plus Fed Chair Powell speaks on Friday, which is another event that can bring a lot of volatility.
However, as we know, we have a new president in the US, who likes to manipulate whatever and whoever he can, among which the markets as well. This means you can expect news to come out of nowhere, even if it's fake sometimes and cause extreme volatility, so be cautious. Don't risk more than you can afford.
Remember, technical analysis is not about forecasting the price, but about reacting to what price does.
As always, this is a game of probabilities, not certainties. Also please note, this is not financial advice, it's my view and understanding of the market.
All charts posted here are screenshots from Tradinview.

If you're a newbie, you may want to check out these guides: