datavizcat(25)•in #vr•2620 days agoDoes VR Enable More Natural Interactions with Data?http://datavizcatalogue.com/blog/wp-content/uploads/2019/01/naturalvrthumbnail.jpg I was introduced online to a PhD researcher, Andrea Bravo, who I talked with ...11$0.00datavizcat(25)•in vr•2620 days agoDoes VR Enable More Natural Interactions with Data?http://datavizcatalogue.com/blog/wp-content/uploads/2019/01/naturalvrthumbnail.jpg I was introduced online to a PhD researcher, Andrea Bravo, who I talked with ...11$0.00
datavizcat(25)•in #mug•2633 days agoNew Official Mug and Store UpdateAnnouncing the release of the Official Data Visualisation Catalogue Mug! Also, there have been a number of updates to the store. https://datavizcatalogue.com/bl...21$0.00datavizcat(25)•in mug•2633 days agoNew Official Mug and Store UpdateAnnouncing the release of the Official Data Visualisation Catalogue Mug! Also, there have been a number of updates to the store. https://datavizcatalogue.com/bl...21$0.00
datavizcat(25)•in #dataviz•2643 days agoTop 10 Most Viewed Chart Reference Pages in 2018http://datavizcatalogue.com/blog/wp-content/uploads/2018/02/rankingthumbnail1png-238x180.png Looking back at 2018, what were the top-10 most popular chart refer...73$0.00datavizcat(25)•in dataviz•2643 days agoTop 10 Most Viewed Chart Reference Pages in 2018http://datavizcatalogue.com/blog/wp-content/uploads/2018/02/rankingthumbnail1png-238x180.png Looking back at 2018, what were the top-10 most popular chart refer...73$0.00
datavizcat(25)•in #dataviz•2645 days agoChart Combinations with Arc Diagramshttps://datavizcatalogue.com/blog/wp-content/uploads/2018/12/arcdiagramcombothumbnail-01-238x180.png Here’s a list of different charts that can be combined with...31$0.00datavizcat(25)•in dataviz•2645 days agoChart Combinations with Arc Diagramshttps://datavizcatalogue.com/blog/wp-content/uploads/2018/12/arcdiagramcombothumbnail-01-238x180.png Here’s a list of different charts that can be combined with...31$0.00
datavizcat(25)•in #vr•2655 days agoSo What’s the Buzz Surrounding VR Data Visualization?During my investigation into the impact of Virtual Reality (VR) technology on data visualization and infographic design was to simply search online what other p...0$0.00datavizcat(25)•in vr•2655 days agoSo What’s the Buzz Surrounding VR Data Visualization?During my investigation into the impact of Virtual Reality (VR) technology on data visualization and infographic design was to simply search online what other p...0$0.00
datavizcat(25)•in #vr•2685 days agoInterview with Suzanne Borders from BadVRhttp://datavizcatalogue.com/blog/wp-content/uploads/2018/11/suzannebordersthumbnail.png Recently, I met online Suzanne Borders whom I found to be exceptionally ...40$0.00datavizcat(25)•in vr•2685 days agoInterview with Suzanne Borders from BadVRhttp://datavizcatalogue.com/blog/wp-content/uploads/2018/11/suzannebordersthumbnail.png Recently, I met online Suzanne Borders whom I found to be exceptionally ...40$0.00
datavizcat(25)•in #dataviz•2686 days agoNEW POST: Looking at Bar/Column Chart Variationshttp://datavizcatalogue.com/blog/wp-content/uploads/2018/11/barchartvariationsthumbnails-01.png Previously, I had already produced a significant number of refer...30$0.00datavizcat(25)•in dataviz•2686 days agoNEW POST: Looking at Bar/Column Chart Variationshttp://datavizcatalogue.com/blog/wp-content/uploads/2018/11/barchartvariationsthumbnails-01.png Previously, I had already produced a significant number of refer...30$0.00
datavizcat(25)•in #vr•2704 days agoFirst thoughts on data visualization in virtual reality (VR)http://datavizcatalogue.com/blog/wp-content/uploads/2018/11/vrthumbnail.png So I’ve started looking into the application of data visualization in virtual realit...0$0.00datavizcat(25)•in vr•2704 days agoFirst thoughts on data visualization in virtual reality (VR)http://datavizcatalogue.com/blog/wp-content/uploads/2018/11/vrthumbnail.png So I’ve started looking into the application of data visualization in virtual realit...0$0.00
datavizcat(25)•in #vr•2710 days agoVR Data Visualization Learnings from the Place ViewerVR Data Visualization Learnings from the Place Viewer https://www.youtube.com/watch?v=bkPAJ8aP89U...0$0.00datavizcat(25)•in vr•2710 days agoVR Data Visualization Learnings from the Place ViewerVR Data Visualization Learnings from the Place Viewer https://www.youtube.com/watch?v=bkPAJ8aP89U...0$0.00
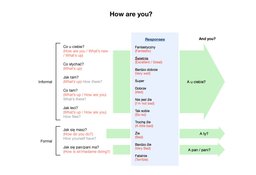
datavizcat(25)•in #polish•2726 days agoThe many ways of asking "How are you?" in PolishA diagram I constructed to show the different ways and combinations when asking "How are you?" in Polish....10$0.00datavizcat(25)•in polish•2726 days agoThe many ways of asking "How are you?" in PolishA diagram I constructed to show the different ways and combinations when asking "How are you?" in Polish....10$0.00
datavizcat(25)•in #dataviz•2727 days agoExploring the many variations and combinations of Proportional Area ChartRecently, I have written a couple of posts exploring the many types of variations and combinations that you can get from a Proportional Area Chart. The first is...0$0.00datavizcat(25)•in dataviz•2727 days agoExploring the many variations and combinations of Proportional Area ChartRecently, I have written a couple of posts exploring the many types of variations and combinations that you can get from a Proportional Area Chart. The first is...0$0.00
datavizcat(25)•in #maps•2821 days agoExploring Travel Time Maps (Isochrone Maps)Just published a NEW long blog post on IsochroneMaps looking in-depth at this chart by exploring the many examples I've found: Further Exploration 9: Isochrone ...40$0.00datavizcat(25)•in maps•2821 days agoExploring Travel Time Maps (Isochrone Maps)Just published a NEW long blog post on IsochroneMaps looking in-depth at this chart by exploring the many examples I've found: Further Exploration 9: Isochrone ...40$0.00
datavizcat(25)•in #map•2832 days agoIsochrones in Maps / Travel times map in CzechiaAn isochrone in a map shows with the same colour all points from which it takes the same time to arrive at a specific location. Below is an example in Czechia s...41$0.00datavizcat(25)•in map•2832 days agoIsochrones in Maps / Travel times map in CzechiaAn isochrone in a map shows with the same colour all points from which it takes the same time to arrive at a specific location. Below is an example in Czechia s...41$0.00
datavizcat(25)•in #maps•2837 days agoChart Combinations: Tile Grid Maps[](http://datavizcatalogue.com/blog/chart-combinations-tile-grid-maps/) http://datavizcatalogue.com/blog/chart-combinations-tile-grid-maps/ I wanted to document...30$0.00datavizcat(25)•in maps•2837 days agoChart Combinations: Tile Grid Maps[](http://datavizcatalogue.com/blog/chart-combinations-tile-grid-maps/) http://datavizcatalogue.com/blog/chart-combinations-tile-grid-maps/ I wanted to document...30$0.00
datavizcat(25)•in #tutorial•2893 days agoData Illustrator Tutorial: How to Draw Bar ChartI recently wrote about a new data visualisation drawing application in development Data Illustrator, which I believe to be very promising. But in this post, I w...40$0.00datavizcat(25)•in tutorial•2893 days agoData Illustrator Tutorial: How to Draw Bar ChartI recently wrote about a new data visualisation drawing application in development Data Illustrator, which I believe to be very promising. But in this post, I w...40$0.00
datavizcat(25)•in #dataviz•2893 days agoCheck Out Xenographics: A Library of Weird ChartsLooking for some weird and wondering forms of data visualisation? Then check out Xenographics, an excellent new chart library by Maarten Lambrechts. https://xen...10$0.00datavizcat(25)•in dataviz•2893 days agoCheck Out Xenographics: A Library of Weird ChartsLooking for some weird and wondering forms of data visualisation? Then check out Xenographics, an excellent new chart library by Maarten Lambrechts. https://xen...10$0.00
datavizcat(25)•in #dataviz•2894 days agoMisleading Data Visualisation and Best Charting PracticesI was invited to give a talk at a UX / UI Design conference CIEMNA STRONA 4: Stranger Things, which took place on 21st March in Kraków, Poland. This conference ...20$0.00datavizcat(25)•in dataviz•2894 days agoMisleading Data Visualisation and Best Charting PracticesI was invited to give a talk at a UX / UI Design conference CIEMNA STRONA 4: Stranger Things, which took place on 21st March in Kraków, Poland. This conference ...20$0.00
datavizcat(25)•in #design•2900 days agoData Illustrator Looks to be a Very Promising ApplicationFor those unaware of Data Illustrator, I've written a post on my initial thoughts for this project: https://datavizcatalogue.com/blog/data-illustrator-looks-pro...30$0.00datavizcat(25)•in design•2900 days agoData Illustrator Looks to be a Very Promising ApplicationFor those unaware of Data Illustrator, I've written a post on my initial thoughts for this project: https://datavizcatalogue.com/blog/data-illustrator-looks-pro...30$0.00
datavizcat(25)•in #dataviz•2903 days agoLive Video from the Presentation I gave at Ciemna Strona UX#4: Stranger ThingsSo a gave a presentation on misleading charts and best charting practices this event, which you can find at 00:57:40 - 01:17:05 [](https://www.facebook.com/ITbe...20$0.00datavizcat(25)•in dataviz•2903 days agoLive Video from the Presentation I gave at Ciemna Strona UX#4: Stranger ThingsSo a gave a presentation on misleading charts and best charting practices this event, which you can find at 00:57:40 - 01:17:05 [](https://www.facebook.com/ITbe...20$0.00
datavizcat(25)•in #dataviz•2904 days agoTalking with Finn Fitzsimons on Chart Creation, Visual Variables, Number Picture, and Potion.jsRecently I’ve been in touch with Finn Fitzsimons, a developer who’s been working on a few data visualisation projects. One project I found particularly interest...50$0.00datavizcat(25)•in dataviz•2904 days agoTalking with Finn Fitzsimons on Chart Creation, Visual Variables, Number Picture, and Potion.jsRecently I’ve been in touch with Finn Fitzsimons, a developer who’s been working on a few data visualisation projects. One project I found particularly interest...50$0.00