
This is a weekly, semi-automated post where I will show some statistics and graphs of the development category. It will also serve as a showcase for the staff picks and task requests that were made in the current week. If you have any suggestions or things you'd like to see in this post, then please let me know!
Previous posts
Top contribution(s)
Scdlang is a description language for describing Statecharts that later can be used to generate code or just transpile it into another format. Although the syntax itself inspired from text-based drawing (e.g mermaid or graphviz), this project is more focused on how to describe Statecharts universally that can be used in another language/platform rather than drawing a Statecharts diagram.
Here is an array of bug fixes/improvements that Clayjohn has made to the Godot engine in the last two weeks. This includes stuff like separating the culling state management from material state in GLES2 and fixing radiance map settings.
Category summary
- There were 10 contributions of which 10 have a chance of being rewarded, or already were rewarded.
- The average score was 73.4 with an average reward of 22.1 STU from Utopian.
- The total reward from Utopian for development contributions this week (so far) is 198.7 STU.
- There were a total of 10 unique contributors in the category. Of those 2 were new contributors in the development category (@bala41288, @bala41288).
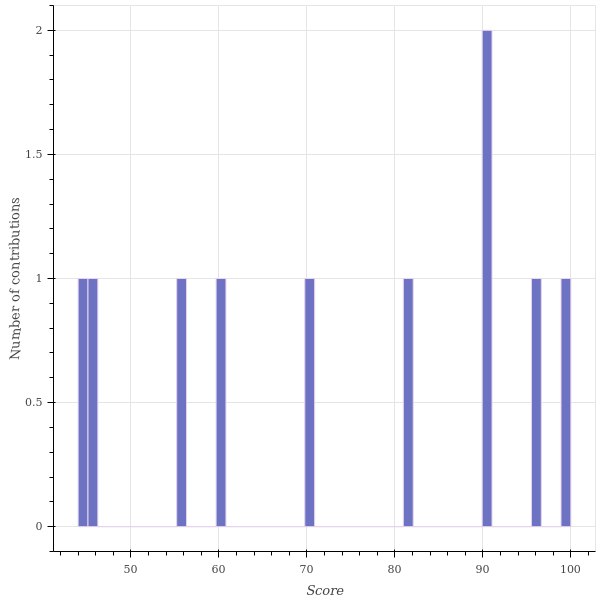
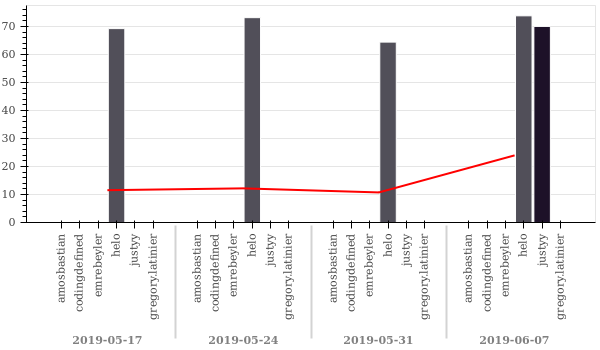
Score distribution in the development category
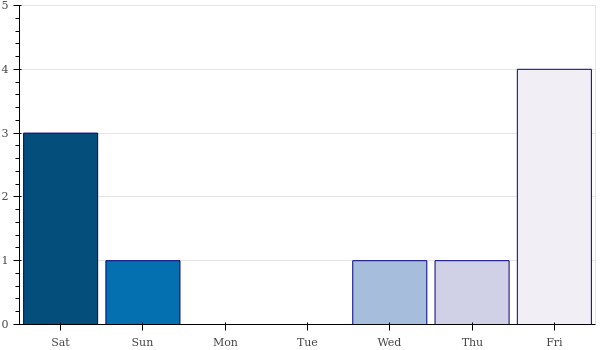
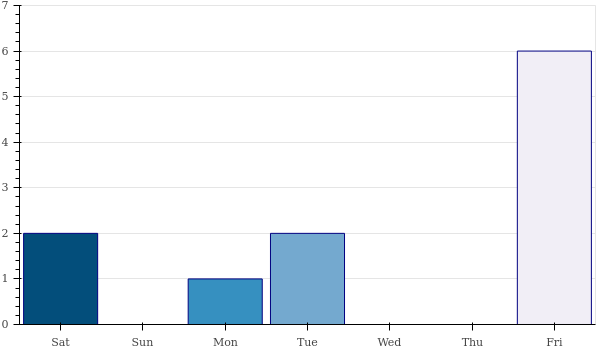
Number of contributions per weekday
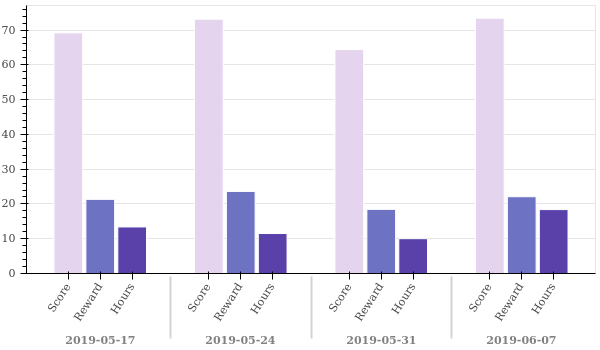
The average score of contributions has gone up from 64.4 to 73.4 this week, which is a good indication that the quality of contributions has also gone up! The average reward, just like the average score, has also gone up (from 18.4 STU to 22.1 STU), which is of course great for our contributors. Lastly, the number of hours it takes for us to get to a contribution and review it (on average) has gone up a lot from 10.0 hours to 18.0 hours.
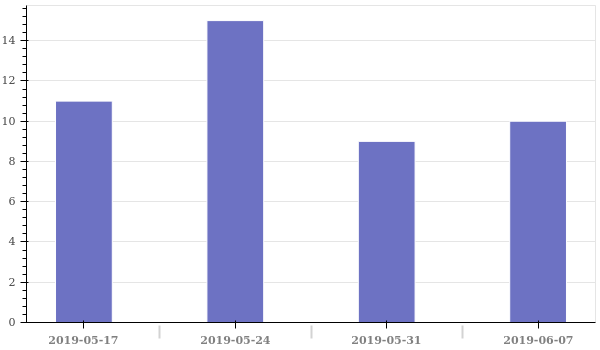
Number of contributions reviewed per week
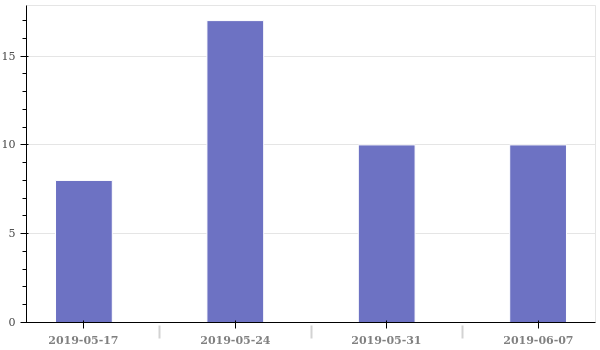
As you can see, the weekly number of reviews has stayed the same as last week. The number of reviews these last two weeks have been a bit less than usual, and so this means that the number of contributions over the last two weeks (20) are also down compared to the number of reviews in the two weeks prior to that (25).
Contributors
Number of unique contributors per week
With the number of reviews staying the same this week it's really cool to see the number of unique contributors has still gone up slightly from 9 to 10!
Moderators
- @helo reviewed 9 contributions with an average score of 73.8.
- @justyy reviewed 1 contribution with an average score of 70.0.
It wasn't just Helo this week for once!
Number of reviews per weekday
Number of contributions reviewed per moderator

Average score given per moderator
Task request(s)
Also, if you think there is anything that can be worded more clearly, then please let me know!