Welcome back to the BeeBalanced blog! We’ve got a new release to share with you all.
So,
@azircon asked if we could dig a little deeper into the SPL metrics side of things. There’s already a Discord bot out there showing some of this info, and Peakmonsters does a solid job of presenting it their own way too.
But… we wanted to take it a step further by using the Splinterlands API directly and building our own view. And of course, throw in a little fun factor while we’re at it.
🔌 The Endpoint We’re Using
If you’re new to the Splinterlands API, you’ll love their Swagger docs. The team did a great job making it accessible for everyone:
📘 Game API:
https://api2.splinterlands.com/doc/🌾 Land API:
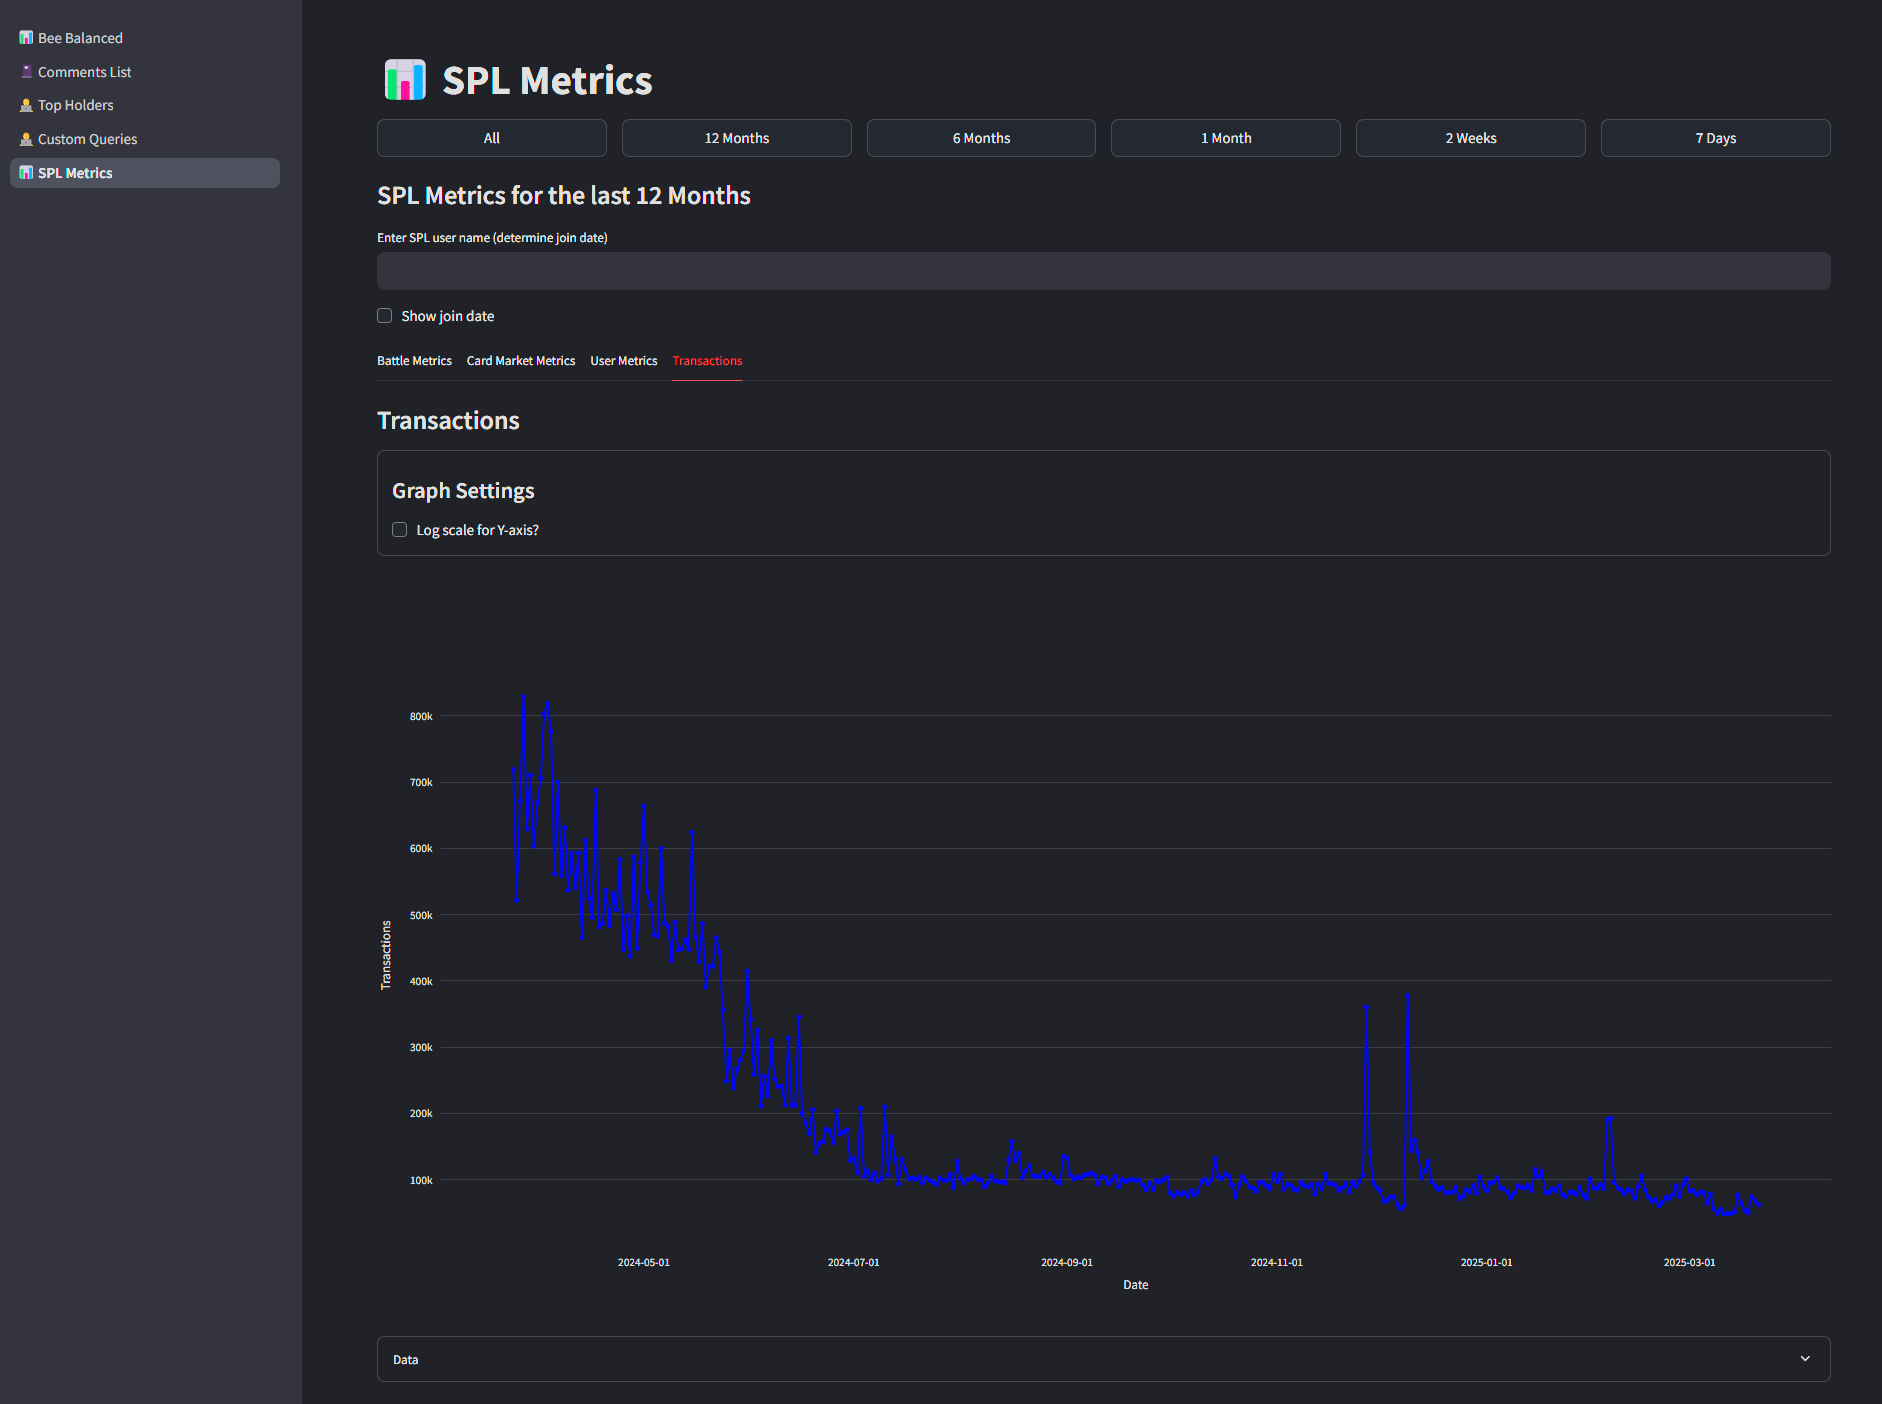
https://vapi.splinterlands.com/swagger/#/📊 What You’ll See
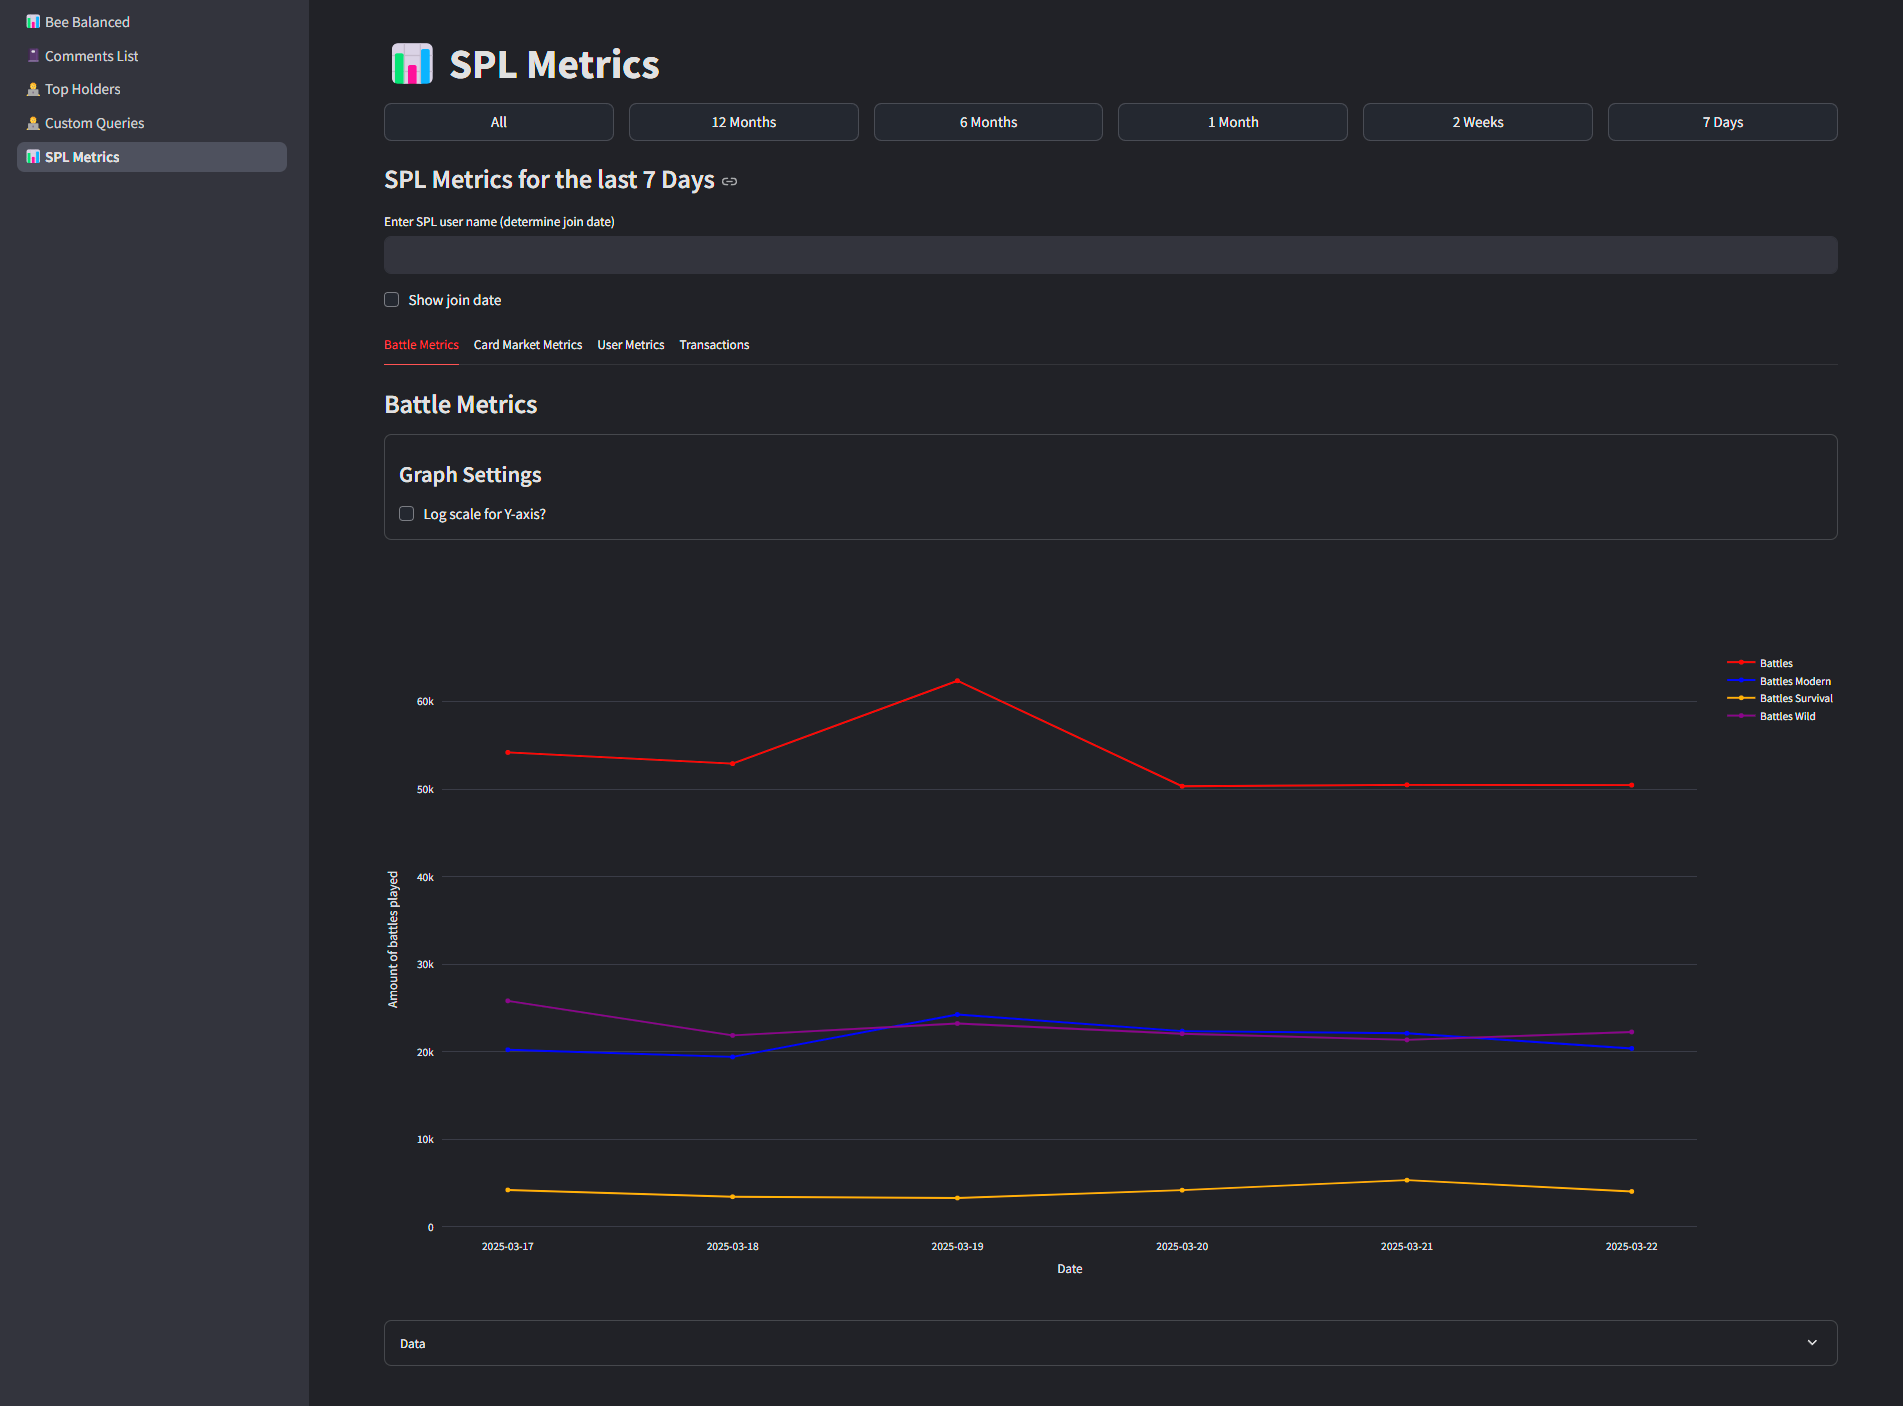
By default, it shows a 7-day view, but you can easily change the timeframe with the buttons at the top.
This is where we go beyond what Peakmonsters and the Discord bot offer:
- No limit in data range
- Fully interactive charts — zoom, pan, select, export — it's all there!
Explore the Four Metrics Tabs
We’ve split the data into 4 main categories, each on its own tab:
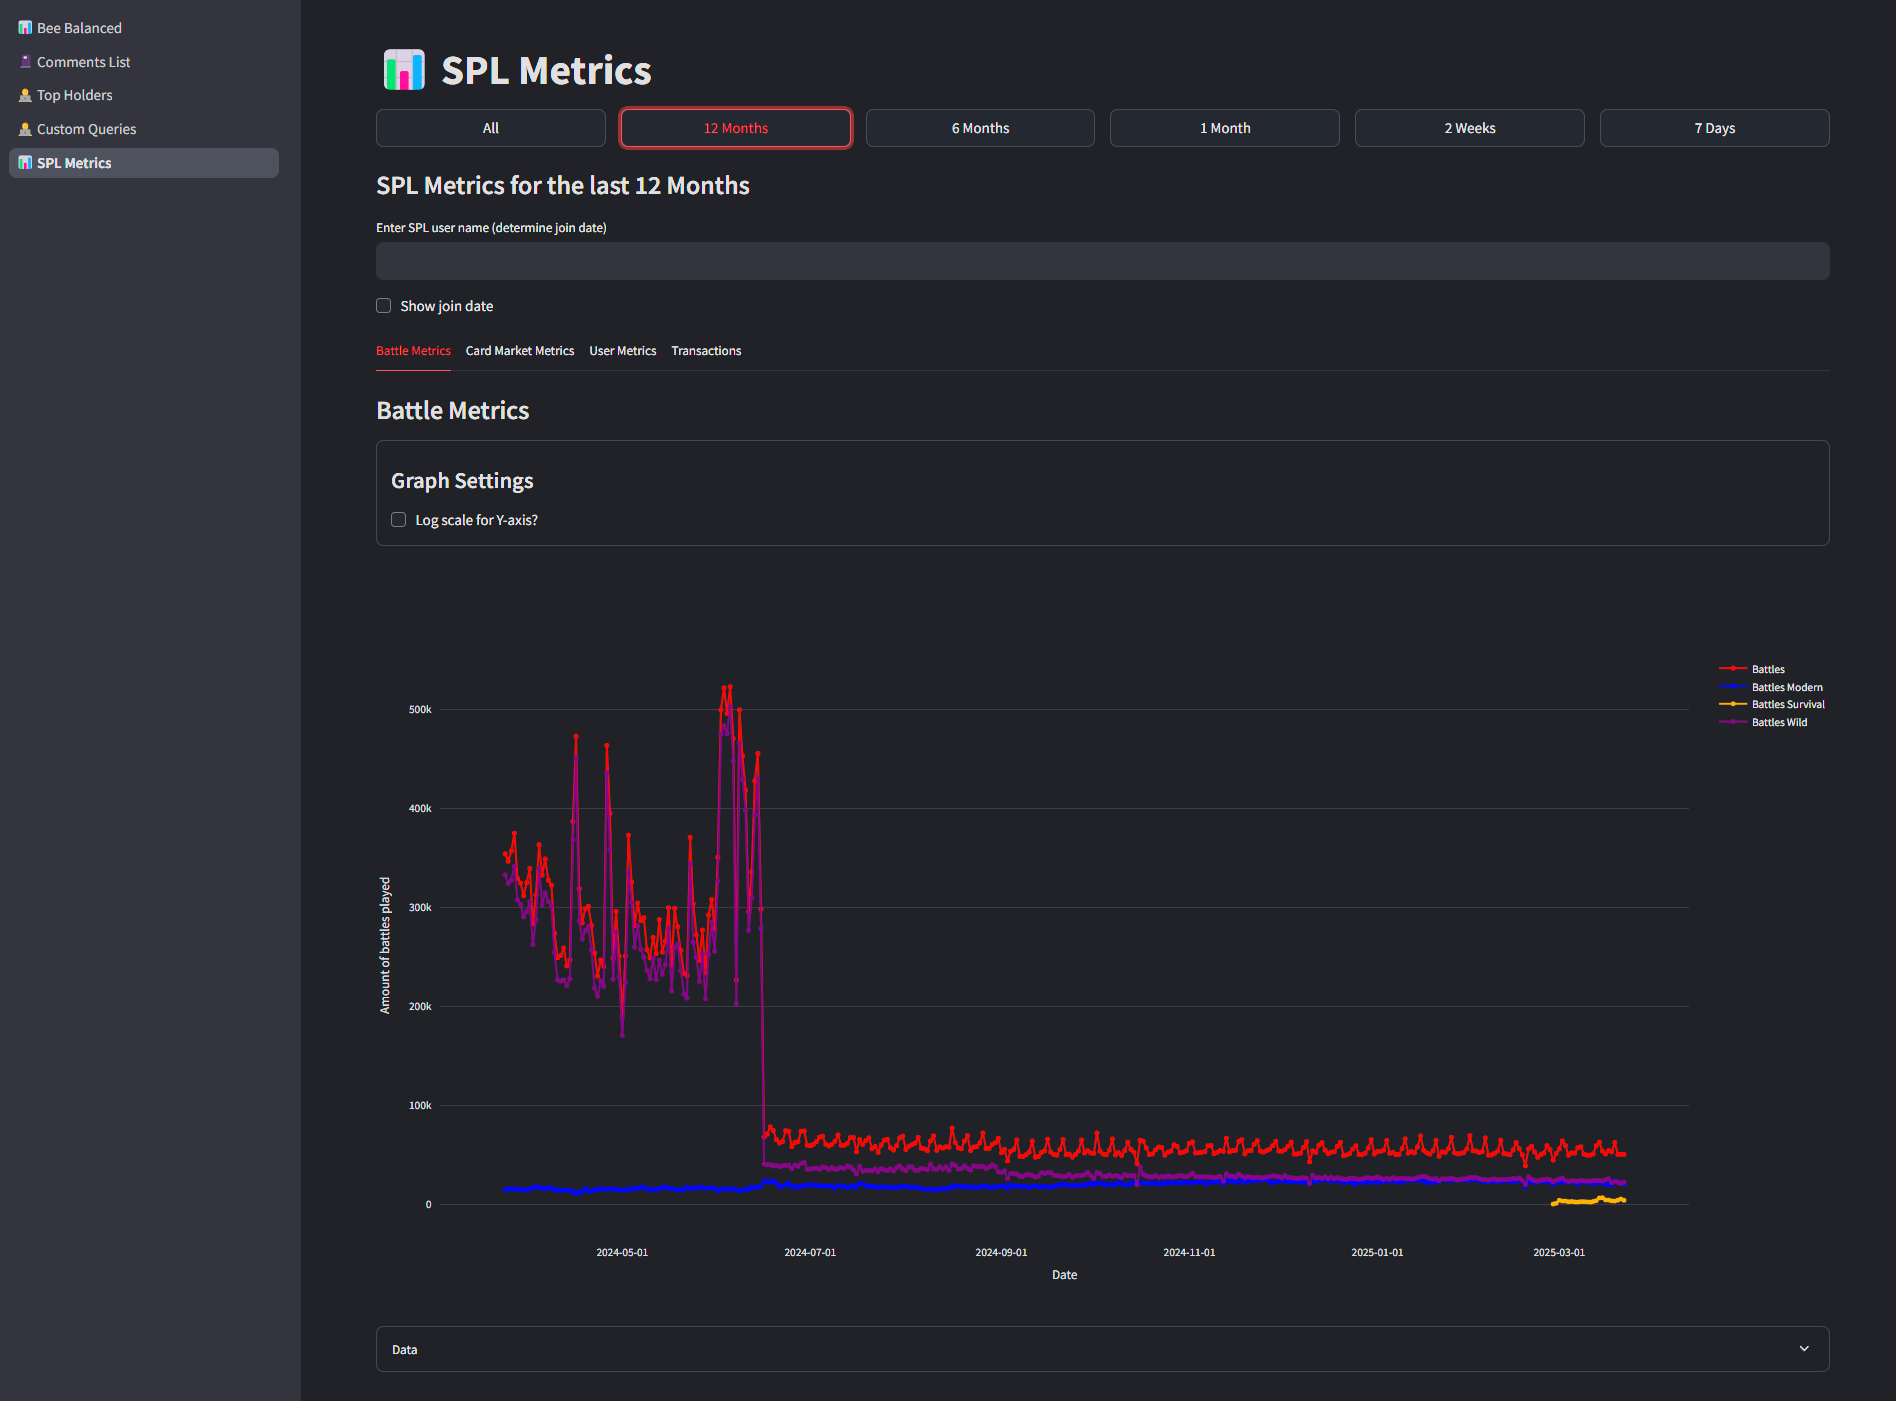
- Battle Metrics
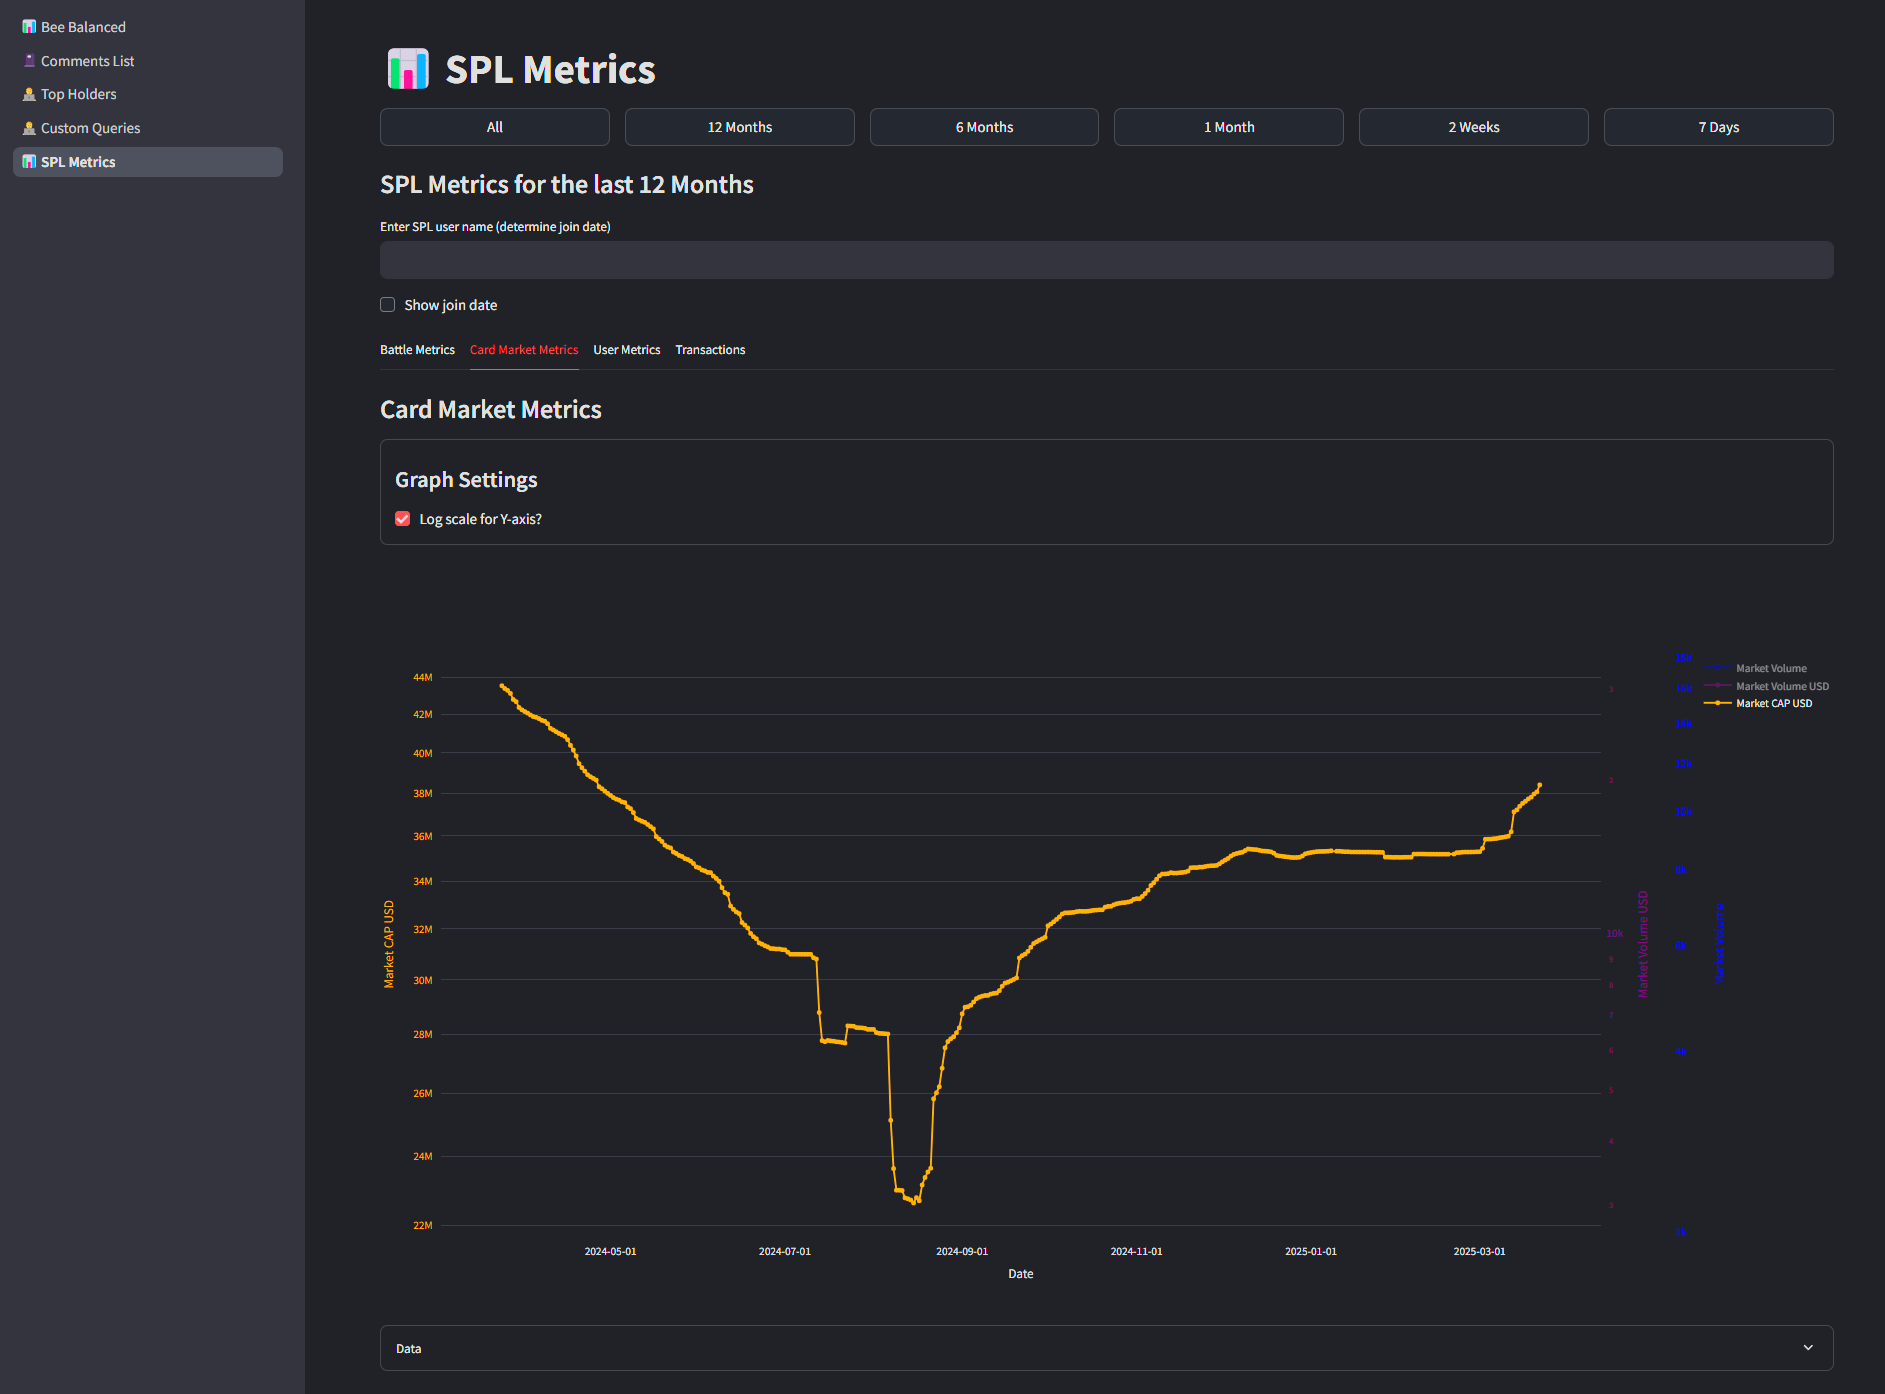
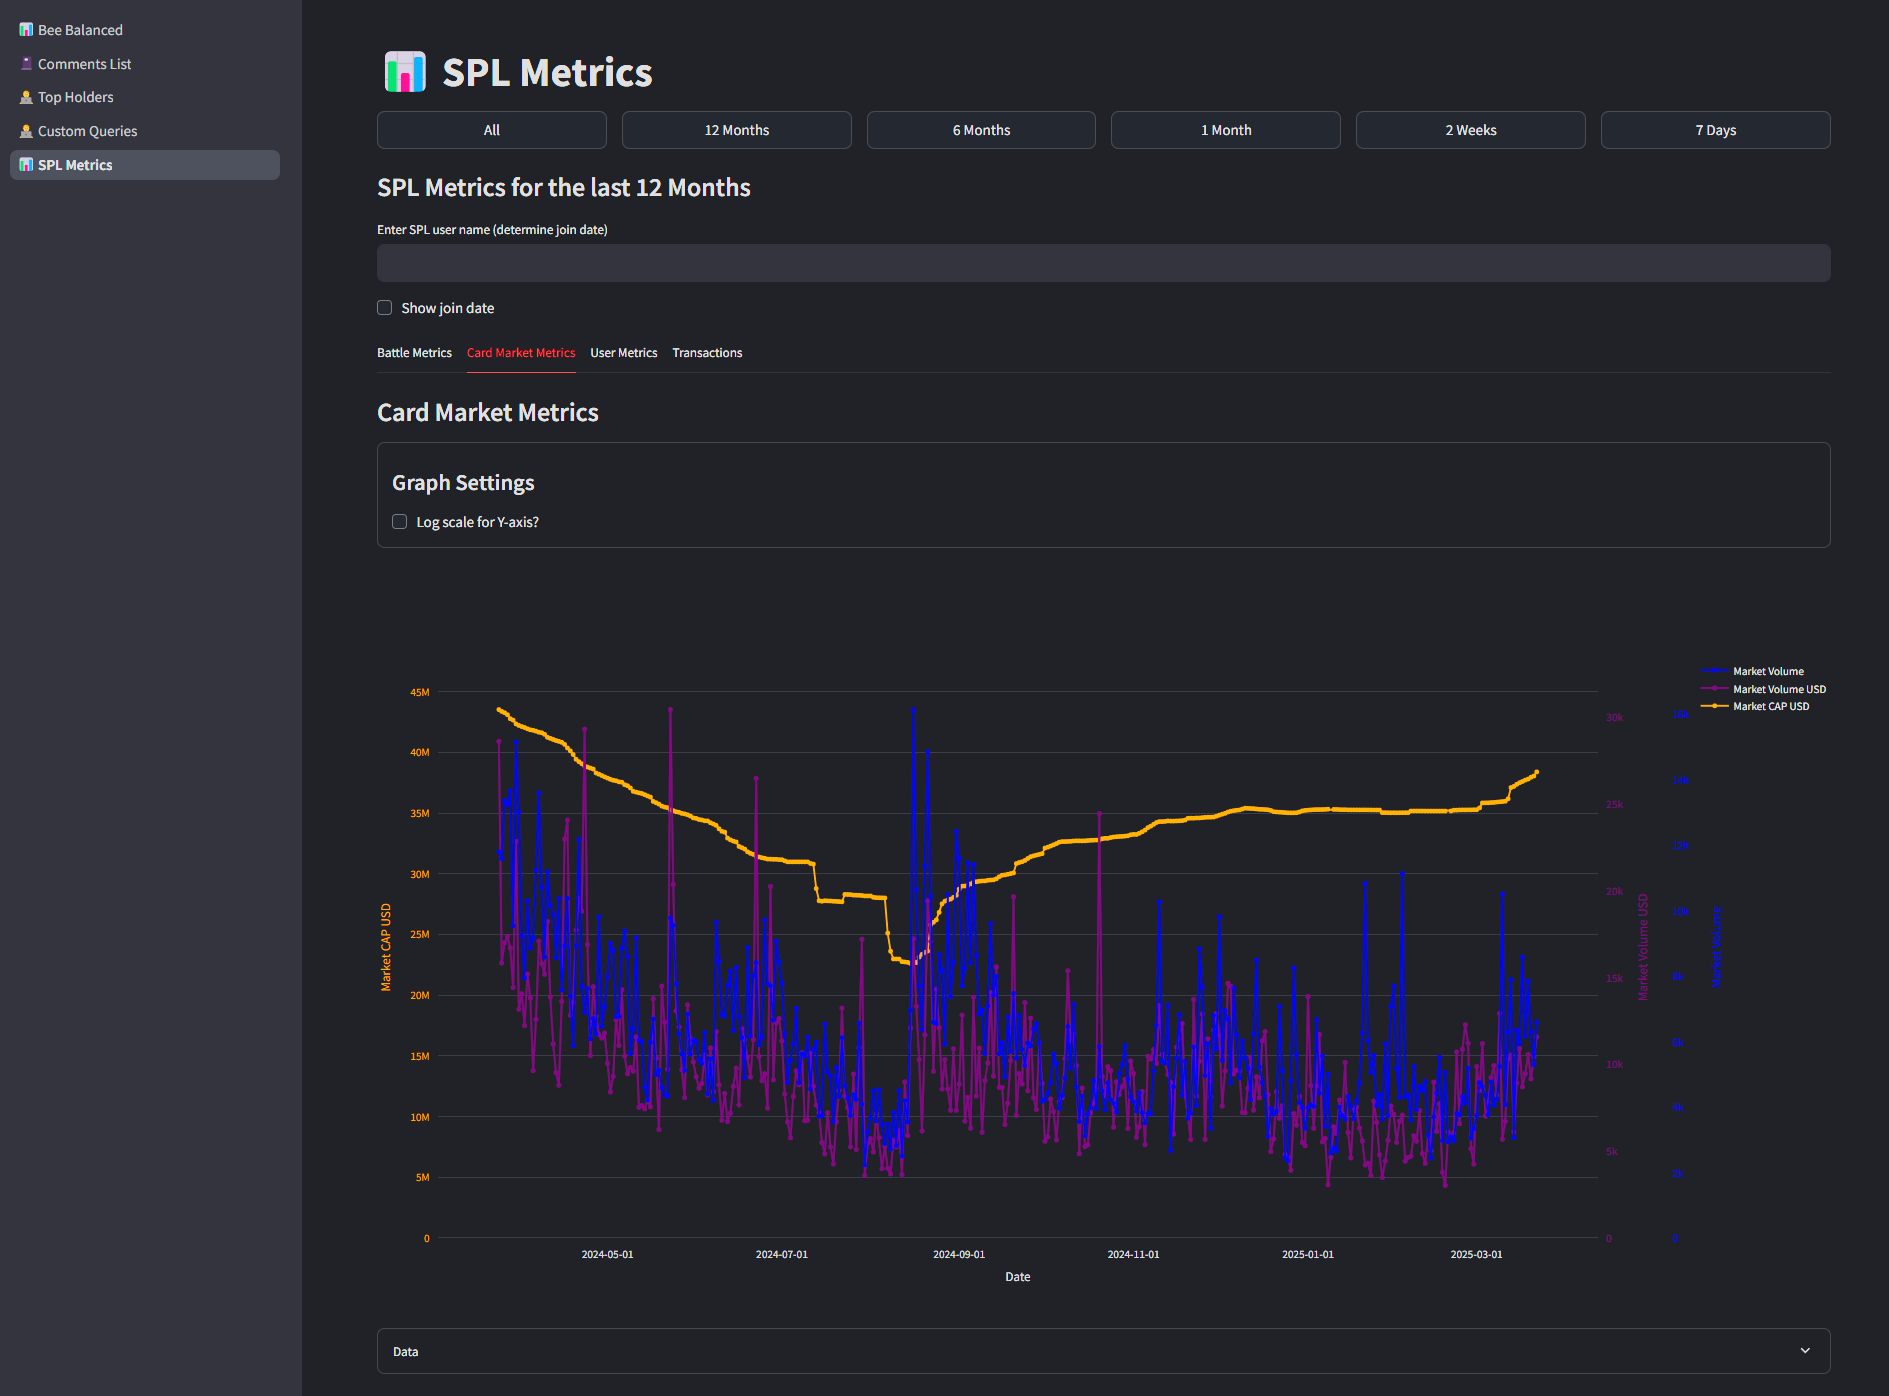
 2.Card Market Metrics
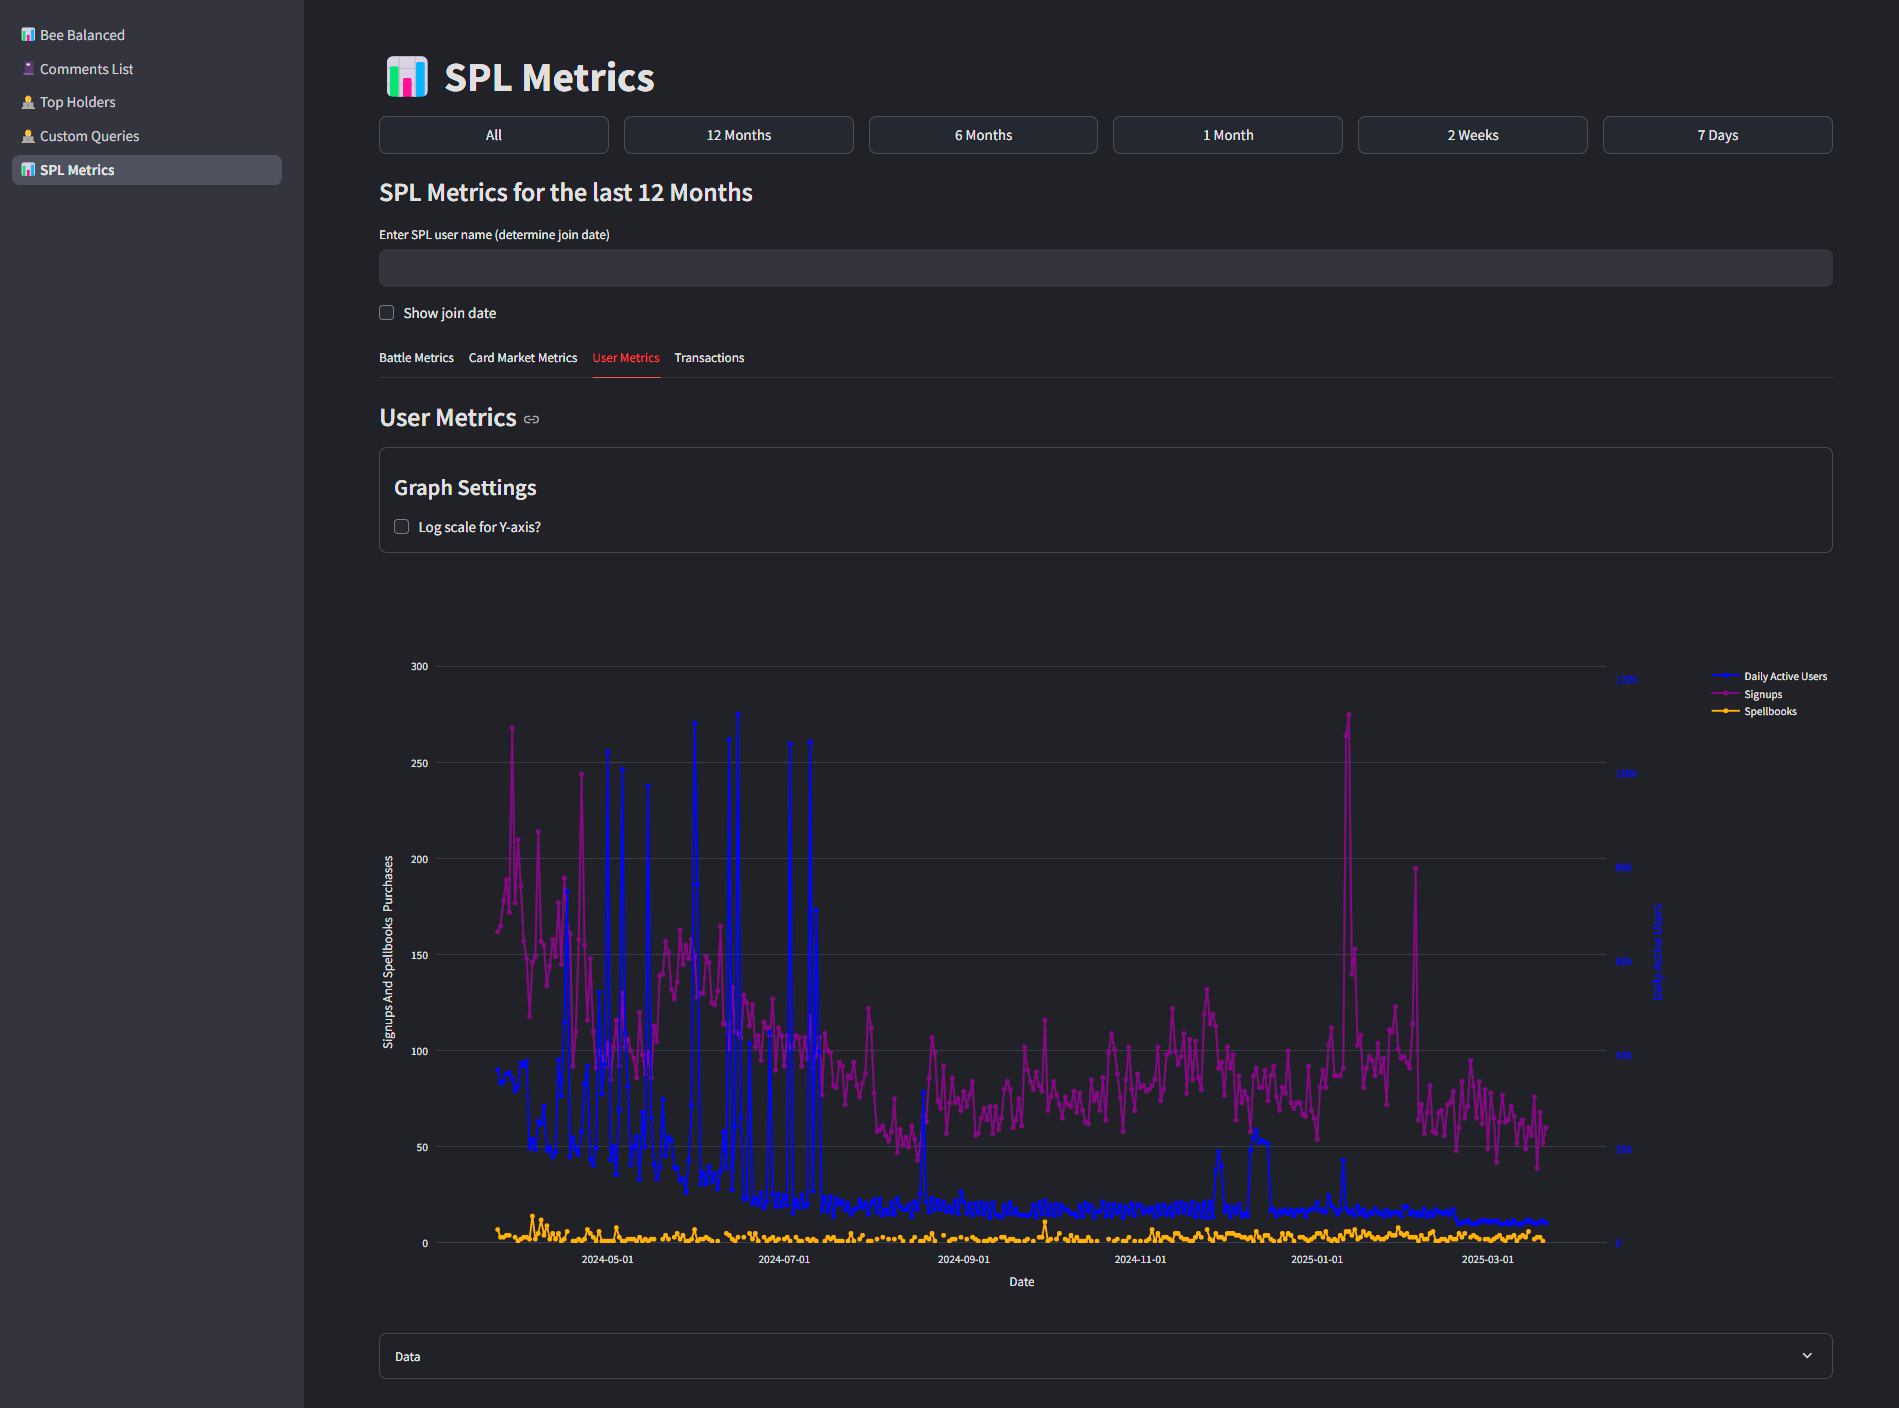
- User Metrics
- Transactions
What I’ll be keeping an eye on in the coming weeks/months when the marketing push starting:
- Spellbook purchases
- Daily battle counts
- Transaction trends
📈 Log Scale – Why It Matters
You’ll see an option to switch the Y-axis to log scale.
So why is log scale useful?
Log scale is handy when your data spans a huge range. Instead of getting a flat line for smaller values and a massive spike for bigger ones, a log scale compresses those big differences and helps you see trends more clearly, even when numbers vary by orders of magnitude.
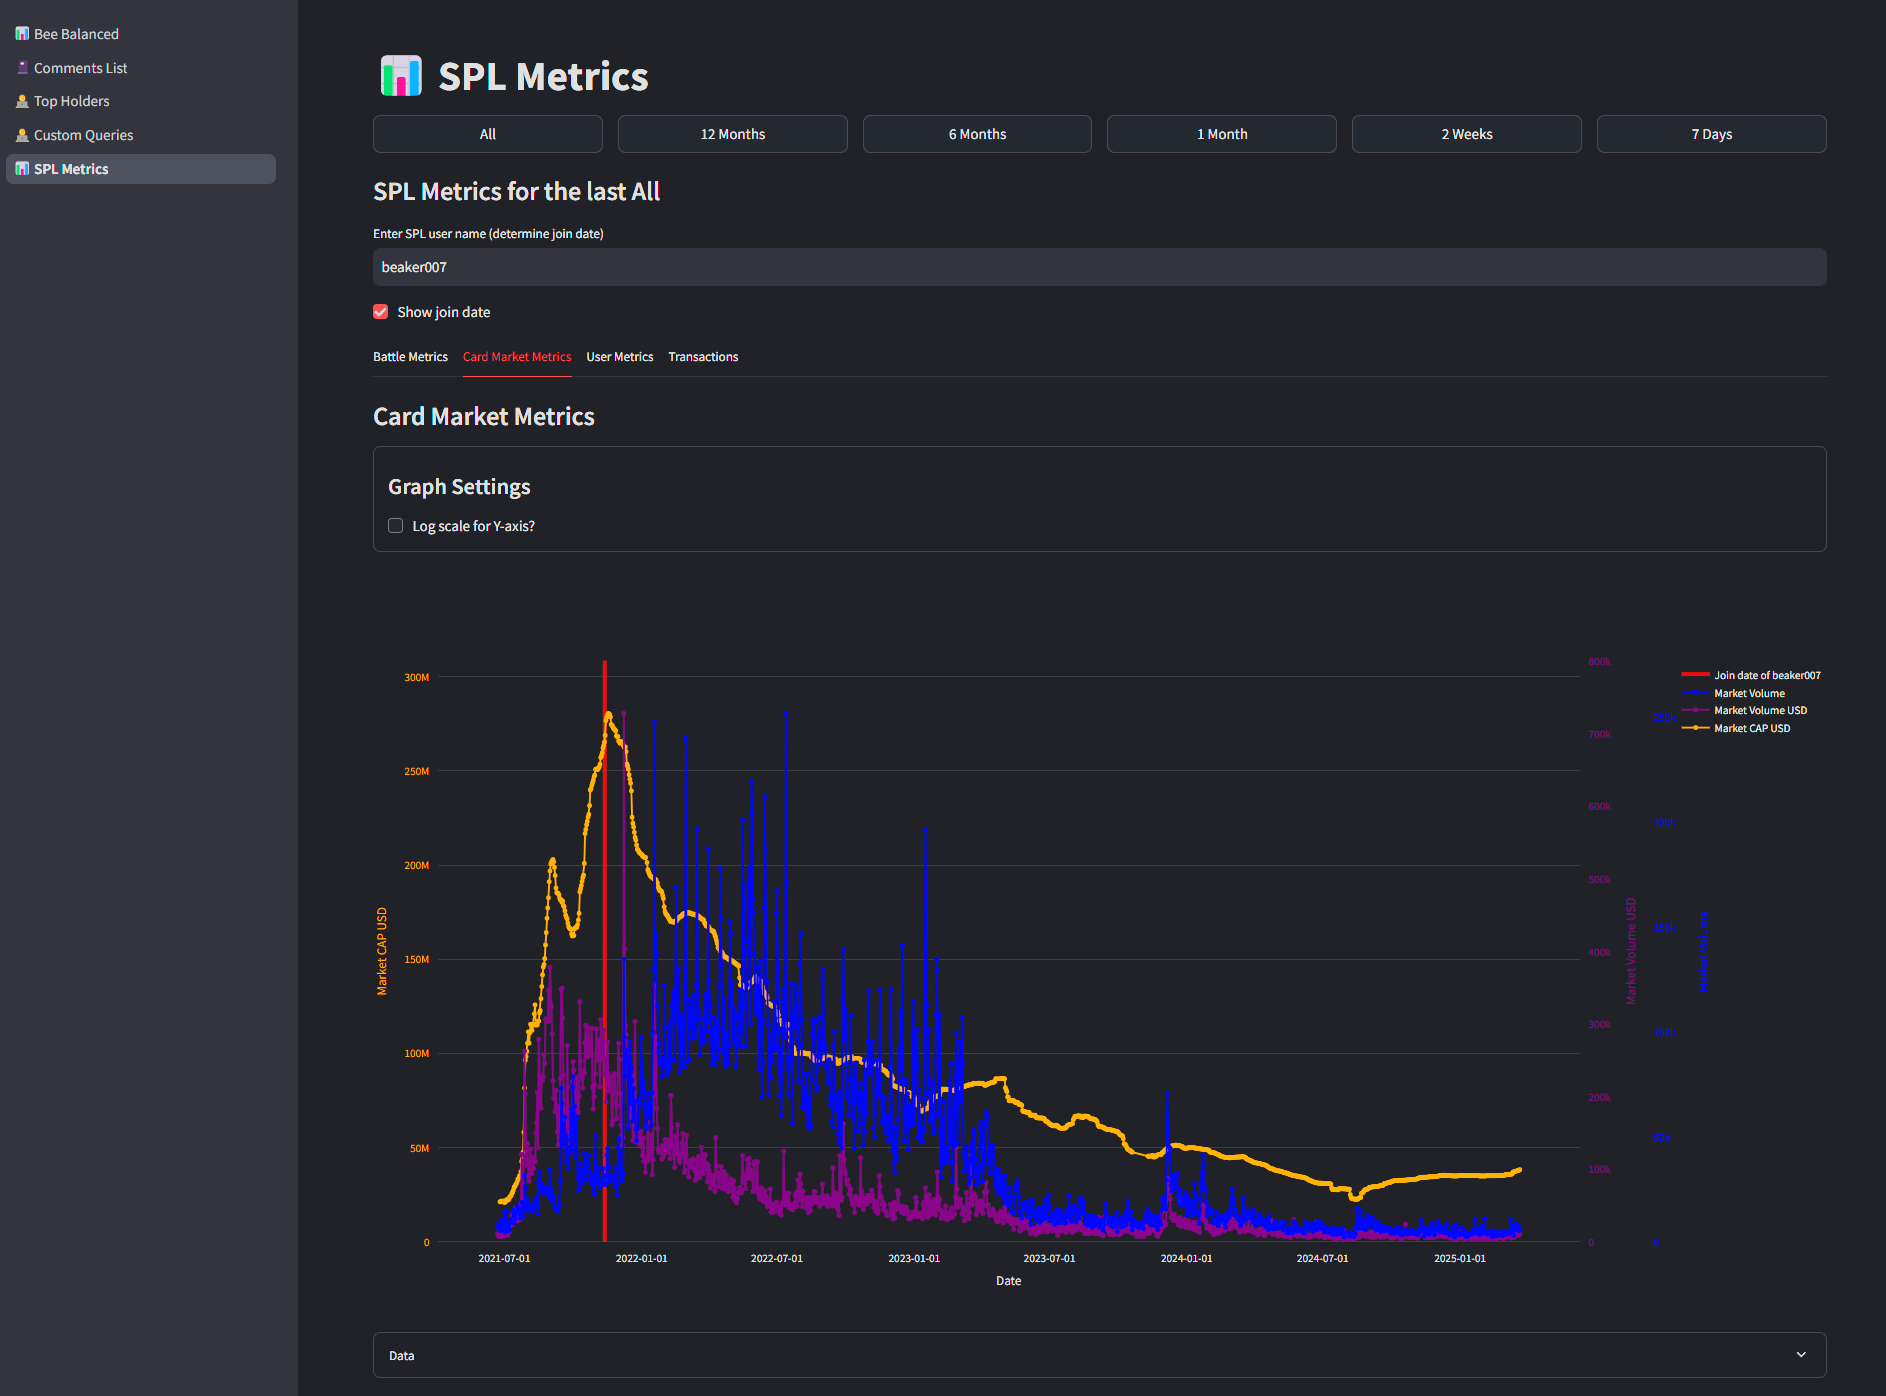
🎯 Bonus Fun: See When a Player Joined
Wanna know when a player started their Splinterlands journey?
Just enter a username, tick “Show Join Date,” and it’ll plot their join date on the chart. Super cool to see where in the hype cycle someone jumped in.
Here’s mine as an example:
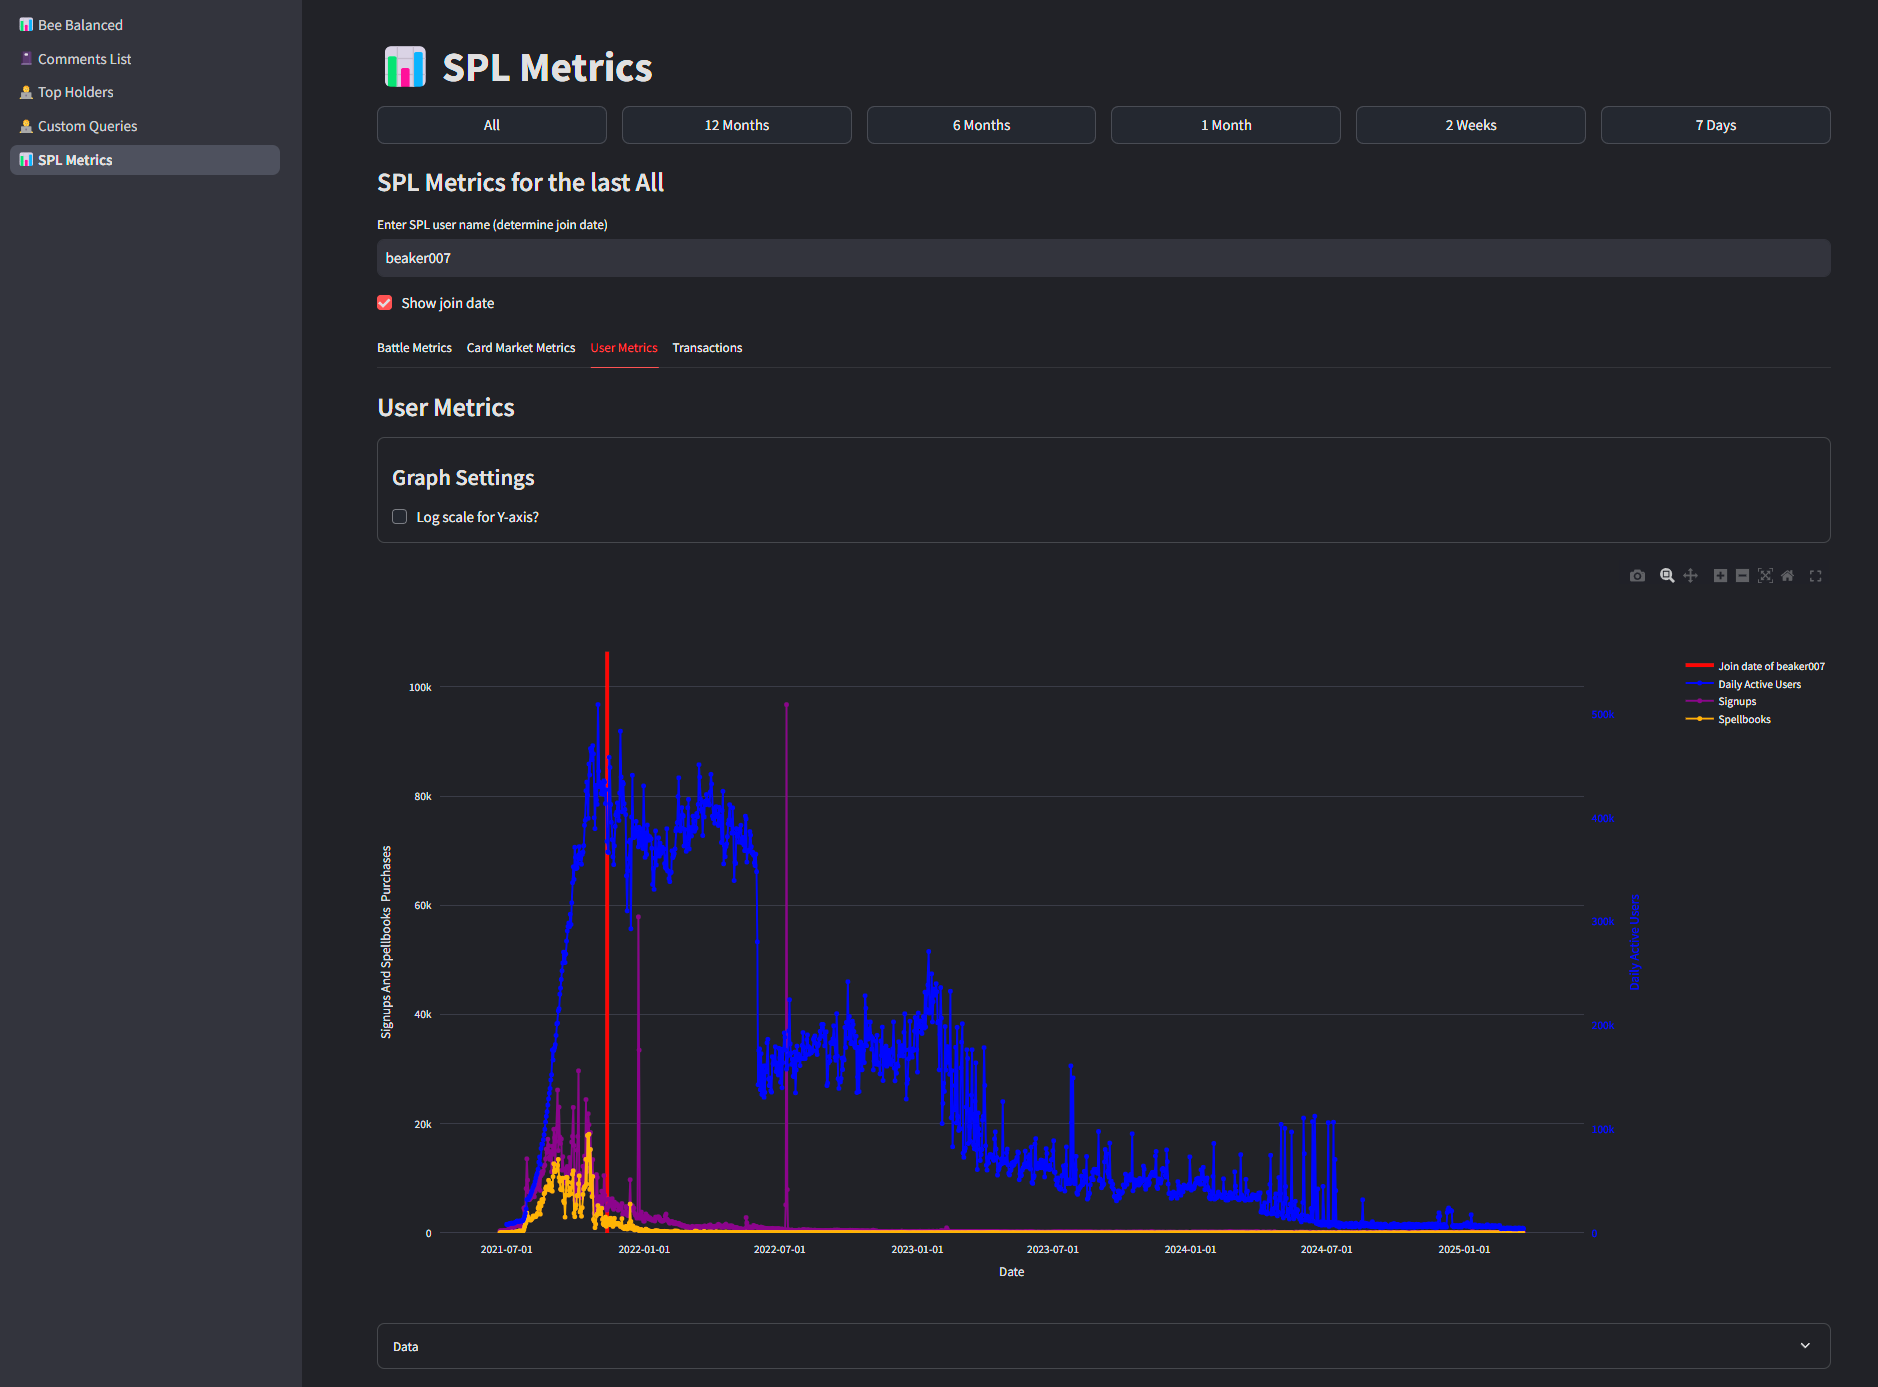
In the middle of the hype or 2021 🤣. I never regretted that this is the way i discover splinterlands and hive. Still enjoying it every day... and yes for asset values i hope there will be better days, turning my red number in at least a neutral position 🤣.
🛠️ Pro Tips for Using the Charts
This is basically for all charts that are being used in beebalanced.
- Drag and Zoom: Select areas to zoom in (box, vertical, or horizontal) (gif showing zooming)
- Line Selection: Click to toggle lines, double-click to isolate or reset

- Double-Click on Graph: Resets the axes
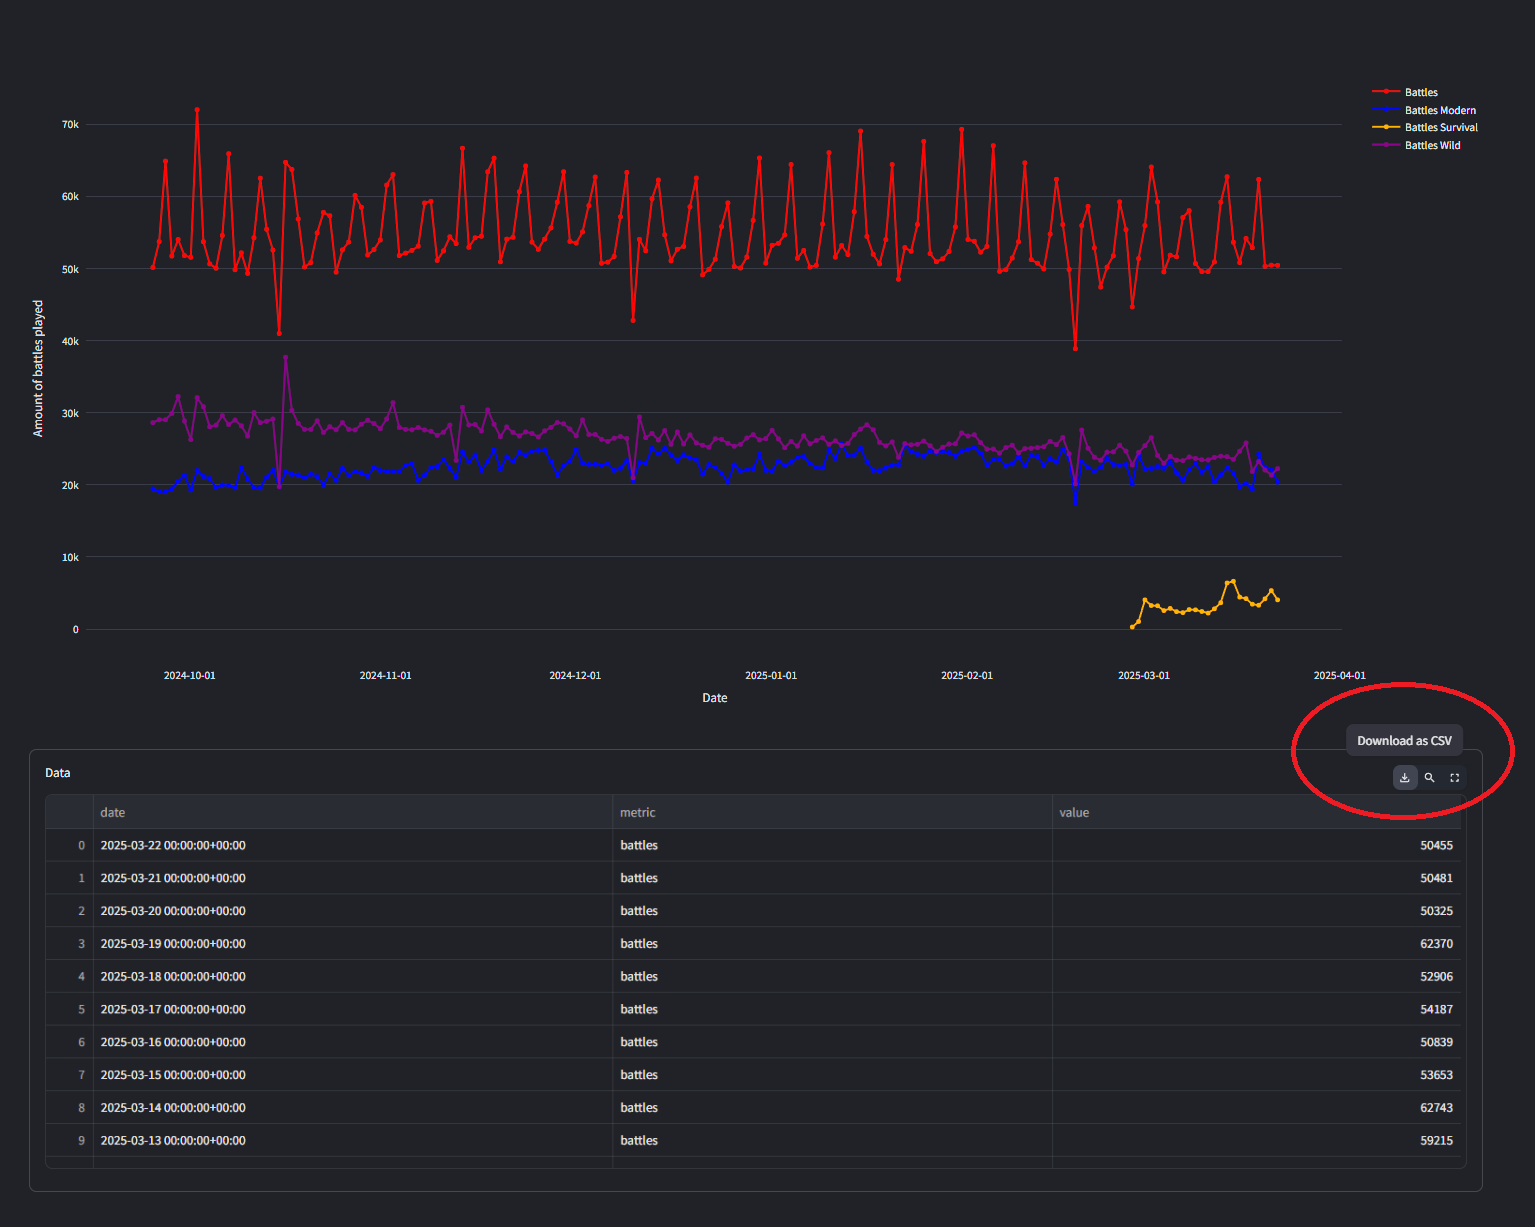
- Download Options: Grab the chart as a PNG with one click
And if that’s not enough, hit the Download CSV button and do your own plotting in your favorite tool. Excel, Google Sheets, Python — whatever works for you!
So there you have it! I hope you enjoy the new feature — SPL Metrics are now live on BeeBalanced! 🎉
If you’ve got feedback, things you’d like to see improved, or totally new ideas… drop me a message. I’d love to make this tool even better with your help.
Happy days to all of you!🐝
Bee Balanced